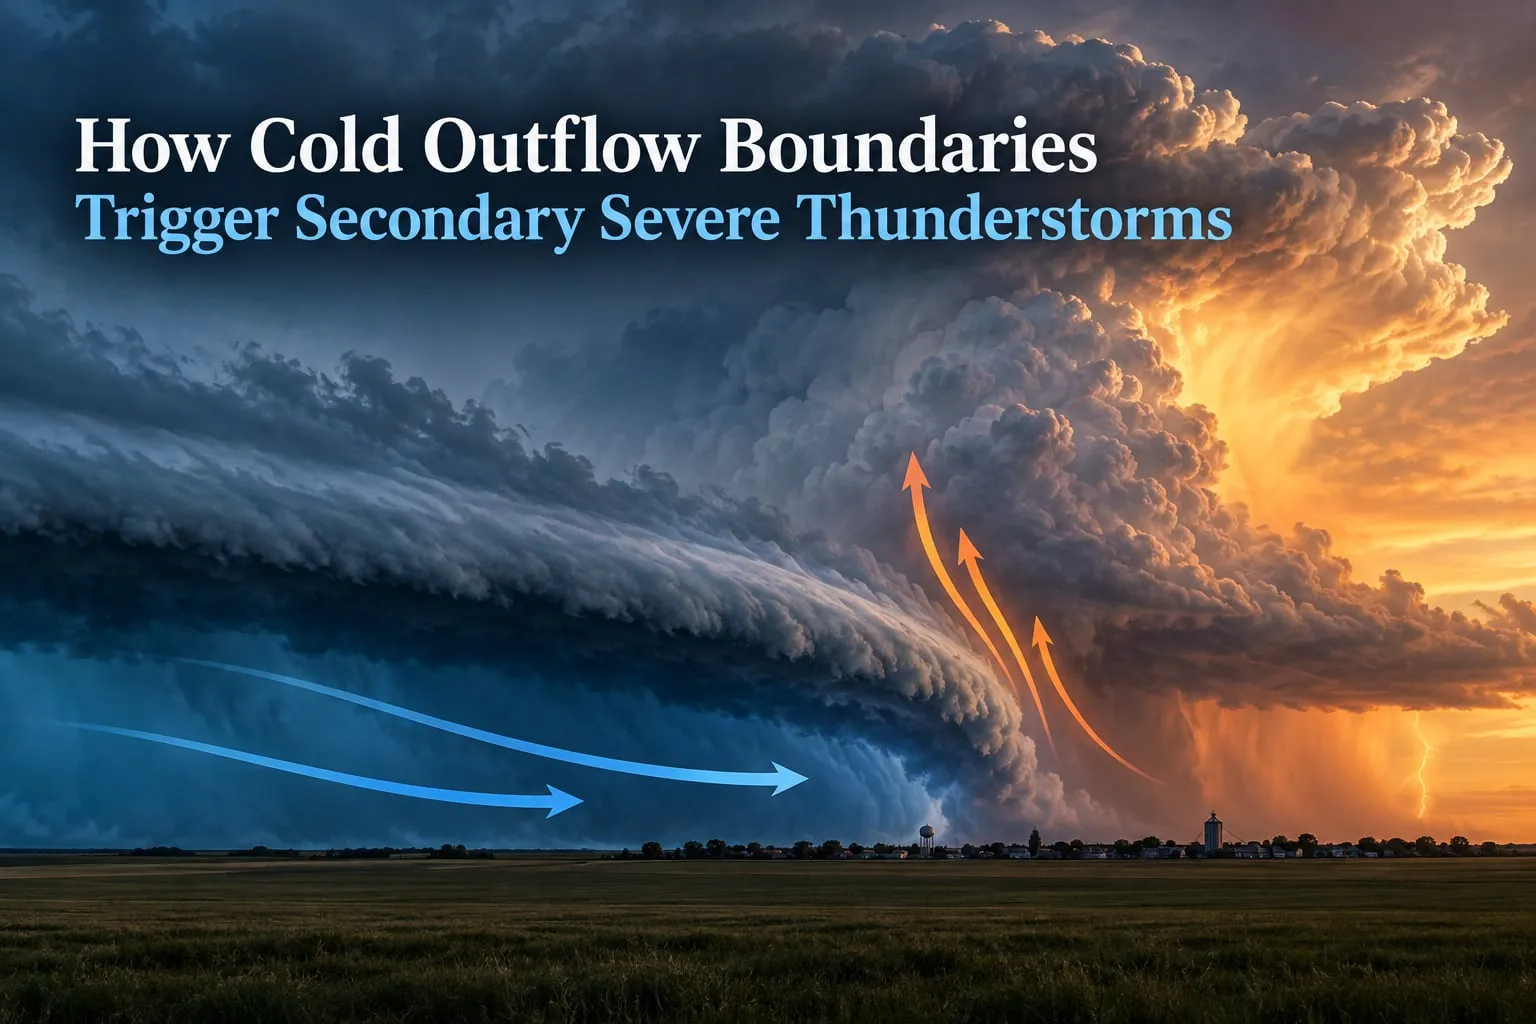
There is a moment in a storm-chasing career that teaches you more than any textbook chapter. A supercell has just torn itself apart, its precipitation core collapsing and its radar echo fading into a smudge behind the mesocyclone. The afternoon looks like it is over. Then the temperature drops six degrees in ninety seconds, the wind swings from south to west, and a fresh line of cells fires along an invisible line running north from the wreckage.
That line is an outflow boundary, and understanding how cold outflow boundaries trigger secondary severe thunderstorms is the single most useful forecasting skill in this field. It tells you where the next storm will start. It tells you that the atmosphere is more unstable than the sounding suggested. And it explains the pattern that spotters see constantly and few people can name: storms dying in one place and reborn along an arc three counties away.
A cold outflow boundary is the leading edge of cool, dense air that pours out from a thunderstorm’s downdraft along the surface. Because that air is denser than the surrounding warm, moist air, it wedges underneath it and forces the warm air upward, and that forced ascent is exactly the lift a new thunderstorm needs to begin. The gust front is the same feature, and the arc cloud you see in photographs is usually its visual signature.
This guide walks through the mechanism step by step, how to read the boundary on radar and from the ground, what happens when two of them intersect, what a boundary does to a storm that already exists, and where the process fails. We use named events with dates, because generic mechanism descriptions are what every other page on this topic already gives you and none of them are enough.
Table of Contents
- What a Cold Outflow Boundary Is
- How the Boundary Forms: From Downdraft to Gust Front
- The Trigger Mechanism: Why Cold Air Forces Storms to Build
- How to Spot a Cold Outflow Boundary on Radar
- What a Cold Outflow Boundary Looks Like From the Ground
- When Two Boundaries Meet: The Collision Zone
- How a Cold Outflow Boundary Triggers Secondary Severe Thunderstorms
- Boundaries That Outlive Their Storms
- When an Outflow Boundary Meets an Existing Storm
- Why Forecast Models Miss Outflow Boundaries
- Case Studies: Boundaries in Real Events
- When a Boundary Instead Kills Storms
- What to Do: Reading the Boundary in Real Time
- Frequently Asked Questions
- Conclusion
What a Cold Outflow Boundary Is
An outflow boundary, also called a gust front, is the boundary between air cooled by a thunderstorm’s downdraft and the surrounding environment. It behaves like a cold front in miniature, complete with its own convergence line, its own lifting mechanism, and its own tendency to spawn new convection along its length.
Meteorologists use several names for it depending on what they are describing. The term gust front refers to the leading edge of the outflow where wind speeds are highest. The term arc cloud refers to the same feature seen on satellite, where the lifted cloud band traces the boundary’s curvature. A shelf cloud is what you see when the boundary lifts moist air ahead of the storm. A wrapping gust front is a boundary that wraps around the precipitation core of a rotating storm and cuts off its inflow.
One distinction matters more than any other. A synoptic cold front is a boundary between two air masses, tens of thousands of feet deep, anchored to the jet stream, and present whether or not any storms exist. An outflow boundary is a mesoscale cold front, roughly 20 to 100 miles across, produced by convection that has already happened, and it dissipates when the atmosphere around it stops supporting it. Jeff Haby’s framing on theweatherprediction.com is the cleanest one-line version available: an outflow boundary is a mesoscale cold front.
How the Boundary Forms: From Downdraft to Gust Front
Every step in the formation of a boundary begins inside a storm that is already raining. Precipitation forms aloft, falls through a column of air that is below freezing, and begins melting. Melting absorbs heat from the surrounding air, cooling it. If the rain is heavy enough, this evaporative cooling does more than cool the air; it makes it negatively buoyant, meaning denser than the air around it, so gravity pulls it down.
The result is a downdraft, and near the ground that downdraft spreads out horizontally in all directions. It hits the surface and spreads as a cold pool, a shallow layer of cool, dense air only a few thousand feet deep at most. The air rises as it goes, because it is colder and therefore denser than the environment above it, until it reaches equilibrium depth.
Virga accelerates this process. When rain falls from a cloud but evaporates before it reaches the ground, the evaporating drops cool the sub-cloud layer without any land surface being reached. Boundary-producing storms do not need to produce a flood or even a wet road. A storm with virga and a strong downdraft can lay down an excellent outflow boundary.
The strength of the boundary depends on how cold the pool is and how deep it is, which forecasters call negative buoyancy energy density. A large hail-producing supercell with a textbook rear-flank downdraft lays down a boundary strong enough to travel hundreds of miles. A weakly organized summer pulse storm produces a thin, ragged line that fades within a few miles of the storm that made it.
The Trigger Mechanism: Why Cold Air Forces Storms to Build
Here is the mechanism in five steps. This is the part most explanations get wrong, because they stop at the phrase convergence and never explain what the converging air is actually doing.
- Cold air descends in the downdraft. Rain-cooled, negatively buoyant air falls from the storm’s precipitation core and hits the surface.
- The cool air spreads outward along the ground. It rushes away from the storm as outflow, forming a widening cold pool bounded by a gust front.
- The dense air wedges underneath the warm, moist air. Because it is colder and heavier, the outflow air cannot simply mix with the environment. It slides beneath it like a wedge driven under a door.
- The warm, moist air is forced to rise. There is nowhere for it to go but up, and rising air cools and condenses into the towering cumulus you watch form along the line.
- Unstable air above turns that ascent into deep convection. If the atmosphere aloft is unstable, the forced rise accelerates into a thunderstorm. If it is not, you get nothing but a line of fair-weather cumulus.
Steps one and two describe where the lift comes from. Steps three and four describe why it is a wedge rather than a mixing zone, and this is the part worth understanding carefully. Cold air and warm air of similar moisture content can blend smoothly. But the outflow air here is both colder and, because it is near-saturated from evaporation, arranged in a shallow dense layer that resists being lifted. It behaves like a cold front because a cold front is exactly the same object at a larger scale.
Step five is the part that catches forecasters. A boundary supplies lift, and lift alone does not make a thunderstorm. The atmosphere above the forced ascent must also contain instability, expressed as CAPE, convective available potential energy, a measure of the energy available to a parcel that is lifted from the surface. The National Weather Service training guidance puts useful thresholds on the other ingredients: surface dewpoints of 55 F or higher favor severe thunderstorms, and low-level convergence along an outflow boundary does the work of providing the lift that the front itself would otherwise provide.
This explains something chasers see constantly. A boundary will sit there for hours producing nothing but a persistent line of cumulus, then a pocket of destabilization arrives, the cumulus grow, and a supercell forms within minutes. The boundary did not change. The instability behind it did.
How to Spot a Cold Outflow Boundary on Radar
A cold outflow boundary shows up on base reflectivity as a fine line: a thin, weak echo marking the density discontinuity where insects, dust, and other near-surface material collect and where the radar beam detects the sharp gradient. The line can be arc-shaped, straight, or broken, and it is often the only thing on radar between a dying storm and whatever comes next.
Use these checks, in order.
- Check for a connected thin line. A real outflow boundary is continuous or semi-continuous over tens of miles and connects to a precipitation area or to where a precipitation area recently was.
- Check motion. The line should move at roughly the speed of the parent storm’s outflow. A line that does not move, or that moves backward, is almost certainly not a gust front.
- Check velocity data. Radial velocity shows convergence along the line, with outbound velocities on the cold side and inbound on the warm side.
- Check the timing. New echoes almost always initiate on the warm side of the line, within a few miles of it, not several miles away.
- Check for a pool of cold air behind it. On low-level analysis, a mesoscale cold front has an actual thermal signature behind it.
Now the mistake that shows up constantly on weather forums. Many of the narrow lines people photograph and ask about are not outflow boundaries at all. They are biological scatterers, insects and birds concentrating along a convergence line for reasons that have nothing to do with temperature. As one r/meteorology discussion put it, the narrow lines used to identify outflow boundaries on radar are often caused by biological scatterers.
How to tell the difference. Biological lines fade in the evening as insects settle for the night, while a real outflow boundary often persists or strengthens overnight because the pool beneath it keeps its density contrast. Biological lines frequently appear where no storm has occurred for hours. A real boundary has a cold pool behind it, visible on surface temperature analysis and on the lowest radar tilt. Biological lines curve with terrain, rivers, and tree lines rather than with a storm’s outflow.
Second radar confusion: a boundary can be obvious on base reflectivity while being invisible on satellite. This happened before a supercell near Wichita, Kansas, on June 16, 2009, where the boundary did not show up at all on surface observations or satellite imagery but became quite apparent on base reflectivity less than an hour before the storm exploded along it. The reverse also happens, when a temperature contrast shows on the surface analysis with no radar signature whatsoever.
The practical rule is to stop treating radar and satellite as one instrument. Base reflectivity is a low-level detector and satellite is a cloud-top detector. A boundary with no clouds on it still has a perfectly good radar signature.
What a Cold Outflow Boundary Looks Like From the Ground
You do not need a radar scope to know a gust front is approaching. The two signs people report most often are a sudden temperature drop and a sharp wind shift, often arriving together within a couple of minutes.
- Shelf cloud. The most common visual marker. It forms as warm moist air is lifted bodily over the advancing cold pool, and it appears as a wedge or arc attached to the storm base. A shelf cloud is a lifting mechanism you can see, which means convection along it is already being forced.
- Roll cloud. A more dramatic variant that forms in a more stable, sheared environment. It is detached from the storm base and rolls along a horizontal axis. Its presence usually means strong low-level wind shear, which matters for aviation safety.
- Wind shift. Winds veer abruptly from south or southeast ahead of the boundary to west or northwest behind it. This is the single most reliable ground indicator.
- Temperature drop. Often ten to twenty degrees Fahrenheit in a few minutes. A sharp drop in humid summer heat is a boundary arriving.
- Pressure jump. A barometer left in a truck will show a sudden rise of a millibar or two as the density discontinuity passes.
- Dust and haboob. In dry downslope or desert environments, the cold pool lifts loose dust into a wall, producing a haboob that can travel well beyond the storm that produced it.
The shelf cloud versus roll cloud distinction is worth keeping straight because they mean different things. A shelf cloud is attached to the parent storm and tells you where the outflow is lifting air right now. A roll cloud sits ahead of the storm, usually in strong shear, and often precedes the gust front by several minutes. Neither guarantees a tornado, and both are frequently mistaken for one.
When Two Boundaries Meet: The Collision Zone
Where two outflow boundaries intersect, forcing roughly doubles, and the intersection point is the single most reliable initiation point in convective forecasting. This is the scenario that spotters and chasers ask about constantly, and the answer is consistent: the intersection concentrates lift and moisture convergence into a very small area, so a single updraft there can produce a storm while storms on either boundary alone stay weak.
Mechanically, three things stack at the intersection.
- Convergence from two directions. Each boundary forces ascent along its own length. Where they cross, the forced ascent does not average out, it adds.
- Moisture pooling. The outflow air pushes surface moisture toward the intersection, so the air being forced upward is moister than the environment a few miles away.
- A localized pressure minimum. The convergence axis corresponds to a low-pressure axis on the mesoscale, and updrafts preferentially form on that axis.
On radar, a developing intersection often produces a single discrete cell that grows rapidly, sometimes before anything fires along either boundary on its own. In an r/CBUSWX discussion of double outflow boundaries, the observation was exactly that: the intersection acts as a trigger, forcing warm moist air upward, which condenses and forms new storms. Another r/weather thread documented intersecting outflow boundaries producing a new line of storms.
There is a visual signature worth watching for. Along a boundary on satellite you often see a line of cumulus, the so-called popcorn street, marking forced ascent. Where two lines of cumulus cross, watch that crossing. Cells there frequently initiate earlier and grow larger than cells along either boundary alone.
Do not treat this as a guarantee. If the environment lacks instability, the intersection produces a brighter, taller cumulus field and nothing more. The intersection supplies lift and moisture, not energy.
How a Cold Outflow Boundary Triggers Secondary Severe Thunderstorms
Put plainly: a cold outflow boundary triggers secondary severe thunderstorms by supplying low-level lift and moisture convergence along a line, in an atmosphere that has enough instability and shear to turn that lift into a rotating storm. The boundary is the trigger. The instability is the fuel. Shear is what turns a tower into a supercell.
Three conditions decide whether a given boundary produces anything.
- Instability behind the line. Check most-recent surface dewpoints and the latest sounding. Dewpoints of 55 F or higher favor severe storms; anything below that generally caps the threat.
- Moisture convergence at the line. The air being lifted should be moister than the air behind the boundary. If dewpoints are higher south of the line than north of it, the forcing is working with you.
- Shear orientation relative to the line. When the low-level shear vector is roughly parallel to the boundary, the environment favors discrete supercells that anchor and cycle. When it is perpendicular, you more often get a bowed line.
On timing, convection usually initiates within a few miles of the boundary, on the warm side. The most common sequence is scattered cumulus along the line, then a few towers, then one dominant cell, then upscale growth into a line or cluster. From the moment the first tower appears to the moment the storm produces a mesocyclone is often under 30 minutes.
Spatial distribution matters too. Initiation is rarely uniform along a boundary. It concentrates where the boundary is oriented favorably to the shear, where the cold pool is deepest, and at intersections with other boundaries or terrain features. If you are picking one place on a 100-mile boundary to watch, the intersection or the shear-aligned segment is where the odds are best.
Boundaries That Outlive Their Storms
A cold outflow boundary can stay effective for up to 24 hours after the storm that produced it has dissipated, which makes it a genuine next-day forecasting tool rather than a same-day curiosity.
The reason is that the temperature contrast itself is the mechanism. As long as the air behind the line stays cooler than the air ahead of it, forced ascent continues along the same line. Overnight, radiation cooling of the surface beneath the cold pool can actually reinforce the contrast while the air ahead of the line stays warm and moist.
The trap here is well documented by chasers. Outflow boundaries from morning convection are often visible on satellite and in surface observations early in the day, then appear to wash out during the afternoon as mixing and cumulus obscure the signal. That does not mean the boundary is gone. Surface observations are sparse, and a shallow cold pool a few thousand feet deep easily slips between stations. The boundary can reappear on base reflectivity an hour before explosive development, as happened near Wichita on June 16, 2009.
Forecasters should treat a washed-out morning boundary as an assumption to verify on radar at low levels, not as evidence it dissolved.
When an Outflow Boundary Meets an Existing Storm
Yes, cold fronts produce tornadoes, and outflow boundaries are mesoscale cold fronts. When a mature supercell intersects a boundary, the interaction is usually more important to the outcome than the boundary’s effect on new initiation.
The most important effect is anchoring. A storm that forms on or just south of a boundary tends to become anchored to it, slowing down and tracking along the line rather than moving with the mean flow. The slowing changes the storm’s inflow geometry, and the inflow stream becomes more aligned with the low-level vorticity that the boundary and the storm’s own updraft produce together.
That alignment is what chasers mean by streamwise vorticity, and it feeds directly into storm-relative helicity, the measure of how much low-level rotation is available to a storm’s inflow. Anchored storms in high-CAPE environments with weak mid-level flow, sometimes under 40 knots, can cycle new mesocyclones away from the precipitation core because the parent storm is not moving fast enough to disrupt them.
The second effect is the deviant right turn. A storm riding a boundary oriented northwest to southeast tends to follow it toward the southeast rather than the expected east or northeast. On radar this reads as a storm that deviates from the mean-wind vector. The Pitcher, Oklahoma case is the clearest example: the storm developed near the Oklahoma-Kansas border moving east, deviated suddenly to the southeast, and produced a long-track violent tornado. Its mid-level rotation was weak compared with typical strong-tornado supercells.
That last point is the important one. A storm can produce a violent tornado on a boundary when the mid-level support looks marginal, because the boundary supplies the low-level vorticity and focus that a tornadic supercell needs.
Why Forecast Models Miss Outflow Boundaries
Numerical models represent outflow boundaries badly for three reasons. Model grids are too coarse to resolve a feature that may be only a few kilometers wide. Model data assimilation does not reliably capture the near-surface temperature structure produced by a storm that dissipated between forecast cycles. And convection schemes parameterized in a model do not produce realistic cold pool temperature drops at the right time and place.
The result is that the storms a boundary produces are frequently unforecast in the convective outlook and missed by mesoscale discussions, not because forecasters were careless but because the feature they needed was not in the model data.
The practical workaround is observational. Use surface analysis plots for temperature and dewpoint gradients, base reflectivity low-level tilts for the fine line, and satellite for the cumulus line along forced ascent. When all three disagree, trust the low-level radar observation, because that is the level the boundary actually exists at.
Case Studies: Boundaries in Real Events
Pitcher, Oklahoma: Boundary-Driven Tornadogenesis, May 10 2008
A storm developed near the Oklahoma-Kansas border and moved east. A northwest-to-southeast oriented outflow boundary, laid down by persistent elevated convection over eastern Kansas and western Missouri, crossed its path. The storm anchored, deviated sharply to the southeast, and produced a long-track violent tornado through Pitcher and on into southwest Missouri.
The striking detail is that mid-level rotation was weak for a storm of that violence, which points to the boundary as the source of the low-level vorticity and focus rather than the mid-level wind profile. This is the case that proves a boundary can drive tornadogenesis independently of classic supercell parameters.
Wichita, Kansas: The Boundary Nobody Could See, June 16 2009
A supercell exploded along an outflow boundary that showed up in neither surface observations nor satellite imagery. The boundary became apparent on base reflectivity less than an hour before initiation, and the storm went on to produce severe weather in an environment that had looked marginal on paper.
This is the case that makes the radar-versus-satellite argument concrete. Anyone positioning on satellite that afternoon would have had no reason to expect initiation, and would have been in the wrong place.
June 24 2009: The Large Boundary Trigger
The National Weather Service documented a case in which a large outflow boundary acted as a trigger for new thunderstorm development, almost like a small-scale cold front. No synoptic front was nearby. The lift was entirely of convective origin, produced by storms that had already exited the region hours earlier.
Chasers who worked these events assemble their own list of productive boundary days, and it is a useful sanity check on how often this matters in practice: June 1 1999, June 3 2001, May 1 2003, May 24 2008, May 26 2008, and June 15 2009. The April 26 1991 and March 13 1990 outbreaks were both influenced by outflow boundaries during periods that were otherwise unremarkable for major severe weather.
When a Boundary Instead Kills Storms
A boundary does not always fire storms. Sometimes it shuts them down, and knowing the difference saves more chase days than any other part of this topic.
The mechanism is cold pool cut-off, sometimes called outflow dominance. It happens when the cold pool spreads faster than the surface beneath it can be warmed and destabilized. The air being forced upward is then cool and stable itself, so it produces shallow, short-lived convection instead of deep towers.
Signs of outflow dominance:
- The cold pool is very wide, often 50 miles or more, with a strong temperature gradient well behind its leading edge.
- Convection on the line is low-topped and produces virga rather than precipitation reaching the ground.
- Surface dewpoints in the cool air are not recovering, because the pool is too deep to be modified by daytime heating.
- Storm tops on the line are flattish and the anvils are small relative to what the environment supports.
- Radar shows the line developing only weakly while new cells form far away in the unmodified warm sector.
An outflow-dominant supercell is a different problem. When a wrapping gust front cuts off the storm’s inflow entirely, the storm cycles through mesocyclones rapidly and then produces nothing. Rotation on radar without an inflow cloud or a wall cloud is a warning that the inflow has been cut off rather than a sign that a tornado is imminent.
The honest summary from experienced chasers is worth repeating: never ignore an outflow boundary, and never treat one as a guarantee. One Stormtrack poster with a long tornado-event record describes both halves of that in the same breath.
What to Do: Reading the Boundary in Real Time
This section is the operational version of everything above. Use it when a radar loop is open and you need to decide where storms will begin.
Before storms fire:
- Locate the parent precipitation area and draw an arc outward from it on radar, ten to forty miles, matching the arc of the observed fine line if one exists.
- Check surface analysis for a mesoscale thermal gradient behind that arc. A real boundary has a cold pool behind it.
- Check the satellite image for a line of cumulus along the same arc. Forced ascent shows up as a popcorn line long before a thunderstorm does.
- Check the latest sounding for dewpoints and CAPE on the warm side of the line. This decides whether you get convection or just cumulus.
- Look for a second boundary, especially a different orientation. Mark the intersection.
- Check low-level shear orientation. Parallel to the line favors discrete anchoring supercells; perpendicular favors a bowed line.
When storms fire:
- Expect initiation within a few miles of the warm side of the line, not in the middle of the domain.
- Watch for a discrete cell that grows rapidly and slows. That is an anchored storm, and anchored storms are the ones worth positioning on.
- Watch for a rightward deviation from the mean-wind vector. That is a boundary-anchored storm, and it is often where the low-level rotation is best concentrated.
- Reassess every ten minutes. A boundary that was productive an hour ago may have been overwhelmed by its own cold pool.
- Confirm the fine line is not biological. If the line fades at sunset and has no cold pool behind it, it is insects.
Safety note. A gust front produces genuinely dangerous straight-line winds, and outflow boundaries with roll clouds indicate strong low-level wind shear that is hazardous to aircraft on approach and departure. Never position a vehicle under the leading edge of a shelf cloud to escape rain, because the wind arrival is faster than most people expect and it arrives with debris.
Frequently Asked Questions
What is an outflow boundary in a thunderstorm?
An outflow boundary, also called a gust front, is the leading edge of cool, dense air that spreads out along the surface from a thunderstorm’s downdraft. Because that air is colder and heavier than the surrounding warm, moist air, it wedges underneath it and forces the warm air to rise. It is effectively a mesoscale cold front, tens of miles wide, produced by convection that has already happened.
How do outflow boundaries contribute to severe weather?
A cold outflow boundary supplies low-level lift and moisture convergence along a line. That forcing is enough to trigger thunderstorms where the atmosphere is unstable, and where low-level shear is present it can anchor storms and enhance low-level rotation. Because the boundary supplies vorticity and focus, it can support tornadogenesis even when the mid-level wind profile looks weak.
What happens when two outflow boundaries collide?
Where two outflow boundaries intersect, forcing roughly doubles and the intersection becomes a focal point for new convection. Convergence from two directions adds rather than averaging out, moisture pools toward the crossing, and a small pressure minimum forms along the axis. Cells frequently initiate first at the intersection, before anything fires along either boundary on its own, provided there is enough instability behind them.
How long does an outflow boundary last?
A cold outflow boundary can stay effective for up to 24 hours after the storm that produced it dissipates, because the temperature contrast between the cold pool and the warm air ahead of it is the mechanism itself. Overnight surface cooling can even reinforce the contrast. Boundaries that appear to wash out on satellite during the afternoon are often still present at low levels and can reappear on base reflectivity before development.
What does an outflow boundary look like on radar?
On base reflectivity a cold outflow boundary appears as a thin fine line, often curved into an arc, marking the density discontinuity along the ground. Radial velocity shows convergence, with outbound velocities on the cold side and inbound on the warm side, and new echoes initiate just on the warm side of the line. A critical caveat: narrow lines caused by insects and birds look similar, but they lack a cold pool behind them and usually fade at night.
How can you tell if a storm is outflow dominant?
Outflow-dominant storms are cut off by their own cold pool. Signs include a very wide cold pool with a strong temperature gradient behind its leading edge, low-topped convection producing virga instead of rain, dewpoints that are not recovering in the cool air, and flattish storm tops. On a supercell, a wrapping gust front that cuts off inflow shows up as rapid mesocyclone cycling without an inflow cloud.
Conclusion
Cold outflow boundaries are the quiet engine of severe weather forecasting. A downdraft lays down a cold pool, the cold pool wedges under the warm moist air, and that forced ascent is where the next storm begins. Read the fine line on radar, verify it against a temperature gradient so you are not looking at insects, and check the intersection points where two of them cross.
Every technique in this guide is observational for a reason: forecast models resolve a feature this small poorly, so the storms a boundary produces are often unforecast. The best forecasters and chasers we know treat a boundary as a strong hint, never a guarantee, and re-check it on radar every ten minutes. If you do that, understanding how cold outflow boundaries trigger secondary severe thunderstorms becomes one of the most reliable edges you can have on the storm of 2026, and every one after it.